Sales-Forecasting-for-Inventory-Optimisation
📈 Sales Forecasting for Inventory Optimization
📘 Overview
This project focuses on improving inventory management for an independent supermarket through accurate sales forecasting. Using Excel-based time series modeling, it compares multiple forecasting techniques—Holt’s Linear Trend, Holt-Winters Seasonal Model, and Damped-Trend Exponential Smoothing (SES with damping)—to determine the most effective method for minimizing stockouts and overstock.
🎯 Objectives
- Forecast monthly sales using time series methods
- Evaluate methods using error metrics (MAE, MAPE, RMSE)
- Recommend a forecasting strategy to optimize stock ordering
- Ensure replicability using only Excel and Solver
🧾 Dataset
- Source: Daily sales volume (Excel)
- Time Range: Jan 1, 2009 – Oct 24, 2020 (hypothetical)
- Entries: 4,315 observations
- Aggregation: Daily to monthly totals for clearer trend/seasonality
📊 Methods Applied
🔹 Holt’s Linear Trend (Method A)
- Captures trend without seasonality
- Uses Excel Solver to optimize level & trend parameters
🖼️ Fig A: Solver Output – Holt’s Linear Trend
🔹 Holt-Winters Seasonal (Method B)
- Captures both trend and seasonality
- Optimizes alpha, beta, and gamma via Solver
🖼️ Fig B: Solver Output – Holt-Winters Seasonal
🔹 Damped-Trend Exponential Smoothing (Method C)
- Adjusts for fluctuating trends using a damping factor
- Solver minimizes absolute error and RMSE
🖼️ Fig C: Solver Output – Damped Trend ES
🔹 Combined Forecast (Method D)
- Averages Methods A, B, and C for improved accuracy
- Leverages the strengths of each individual model
🖼️ Fig D: Combined Forecast Output
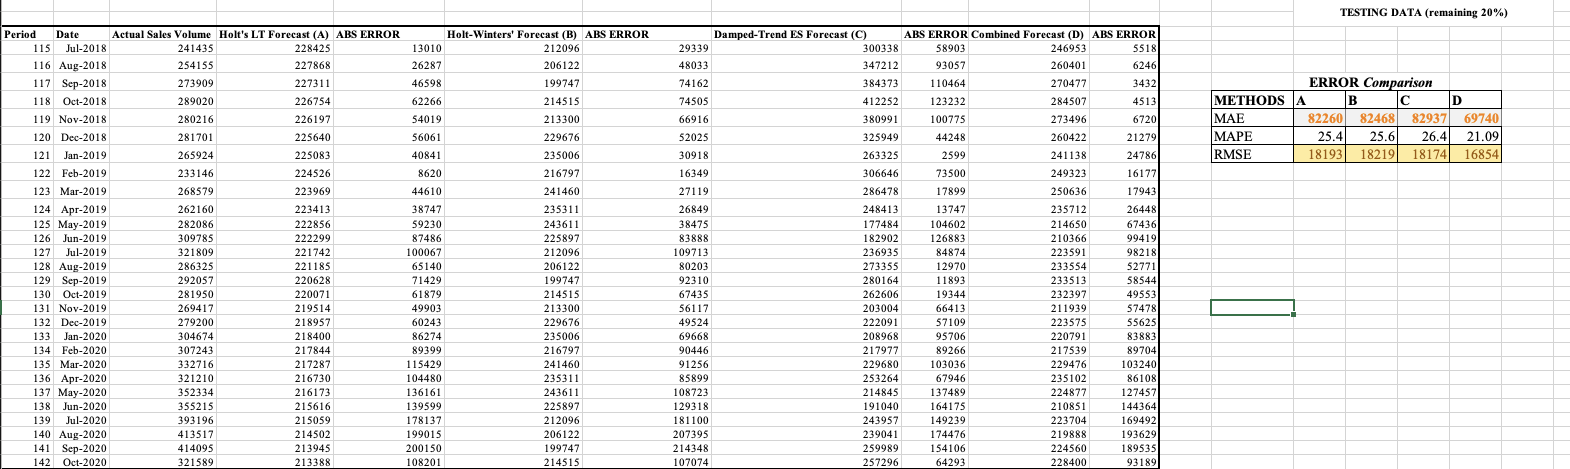
📈 Evaluation: Error Metrics
| Method | MAE | MAPE | RMSE |
|---|---|---|---|
| A | 82,260 | 25.4% | 18,192.65 |
| B | 82,468 | 25.6% | 18,219.33 |
| C | 82,937 | 26.4% | 18,174.48 |
| D | 69,740 | 21.09% | 16,854.37 |
🖼️ Fig E: Forecast Accuracy Comparison
✅ Findings & Recommendations
- The Combined Forecast (Method D) is the most accurate and reliable.
- Use Method D for monthly order decisions to minimize stockouts and overstock.
- Monitor forecast vs. actual sales monthly to recalibrate model if needed.
- Solver settings and parameters are fully documented in the workbook.
🔁 Replication & Audit
- Each method is clearly structured in Excel with labeled parameter cells
- Solver steps are reproducible
- “Cleaned Data” tab shows aggregated input with original trend patterns
🚀 Getting Started
- Download the Excel workbook from this repository
- Open
Enterprise Data.xlsxGet Dataset Here - Navigate to each method’s worksheet
- Use Solver to minimize RMSE and observe forecast outputs
📚 Reference
Makridakis, S., Spiliotis, E., & Assimakopoulos, V. (2020).
The M4 Competition: 100,000 time series and 61 forecasting methods.
International Journal of Forecasting, 36(1), 54–74.
https://doi.org/10.1016/j.ijforecast.2019.04.014
👤 Author
Ramanav Bezborah
🔗 GitHub Profile